I restarted a 10 year old Xeon 174 times to delete twelve flags and gain four tokens a second
By Christina Emilie Sørensen
22 minutes read
A follow-up to running Gemma 4 on a 2016 Xeon. I took that 25-flag config apart one flag at a time, to find which ones actually do the work, which are harmful, and which are just pitfalls. Most of my tuned config will do nothing for the typical user.
A couple of weeks ago I got Gemma 4, a 26-billion-parameter model, running at reading speed on a 2016 Xeon with no GPU and 128 GB of DDR3. That post spent about eight hours on the front page of Hacker News, which means a lot of people now have a 25-flag command sitting in a terminal somewhere, copied from a blog, with no real idea which of those flags is doing the work.
I have some bad news about that command. You’re likely holding it wrong.
What I said in that post in passing, is that half of those flags would not take just by being present. Some need the right hardware. Some need the right host setup. Some only help on the right workload. The engine accepts all of them and tells you almost nothing about which ones actually fired. So this post is me going back and finding out what will actually work for YOU.
The way you find out is an ablation. You take the working config, switch off exactly one flag, measure what changes, put it back, and do the same for every flag in turn. The word is borrowed from neuroscience by way of machine learning, where it normally means knocking out a piece of the model itself, an attention head or a layer, to see what it was for. I am using it a little improperly here, for inference flags rather than model internals, but the idea carries over: turn one thing off, measure, repeat, and the differences tell you what each piece was worth.
It was a lot of work. Like a lot. One hundred and seventy-four runs, each one a fresh server reloading twenty-five gigabytes of weights off a spinning disk before it can answer a single token. Three prompts per launch, several repetitions each, and one entire overnight run I had to throw in the bin over a deadlock I will get to. I am telling you the count because the count is the point. The reason nobody knows which of these flags matter is that finding out is slow and tedious, so almost nobody does it. I did, so here is the answer.
The setup
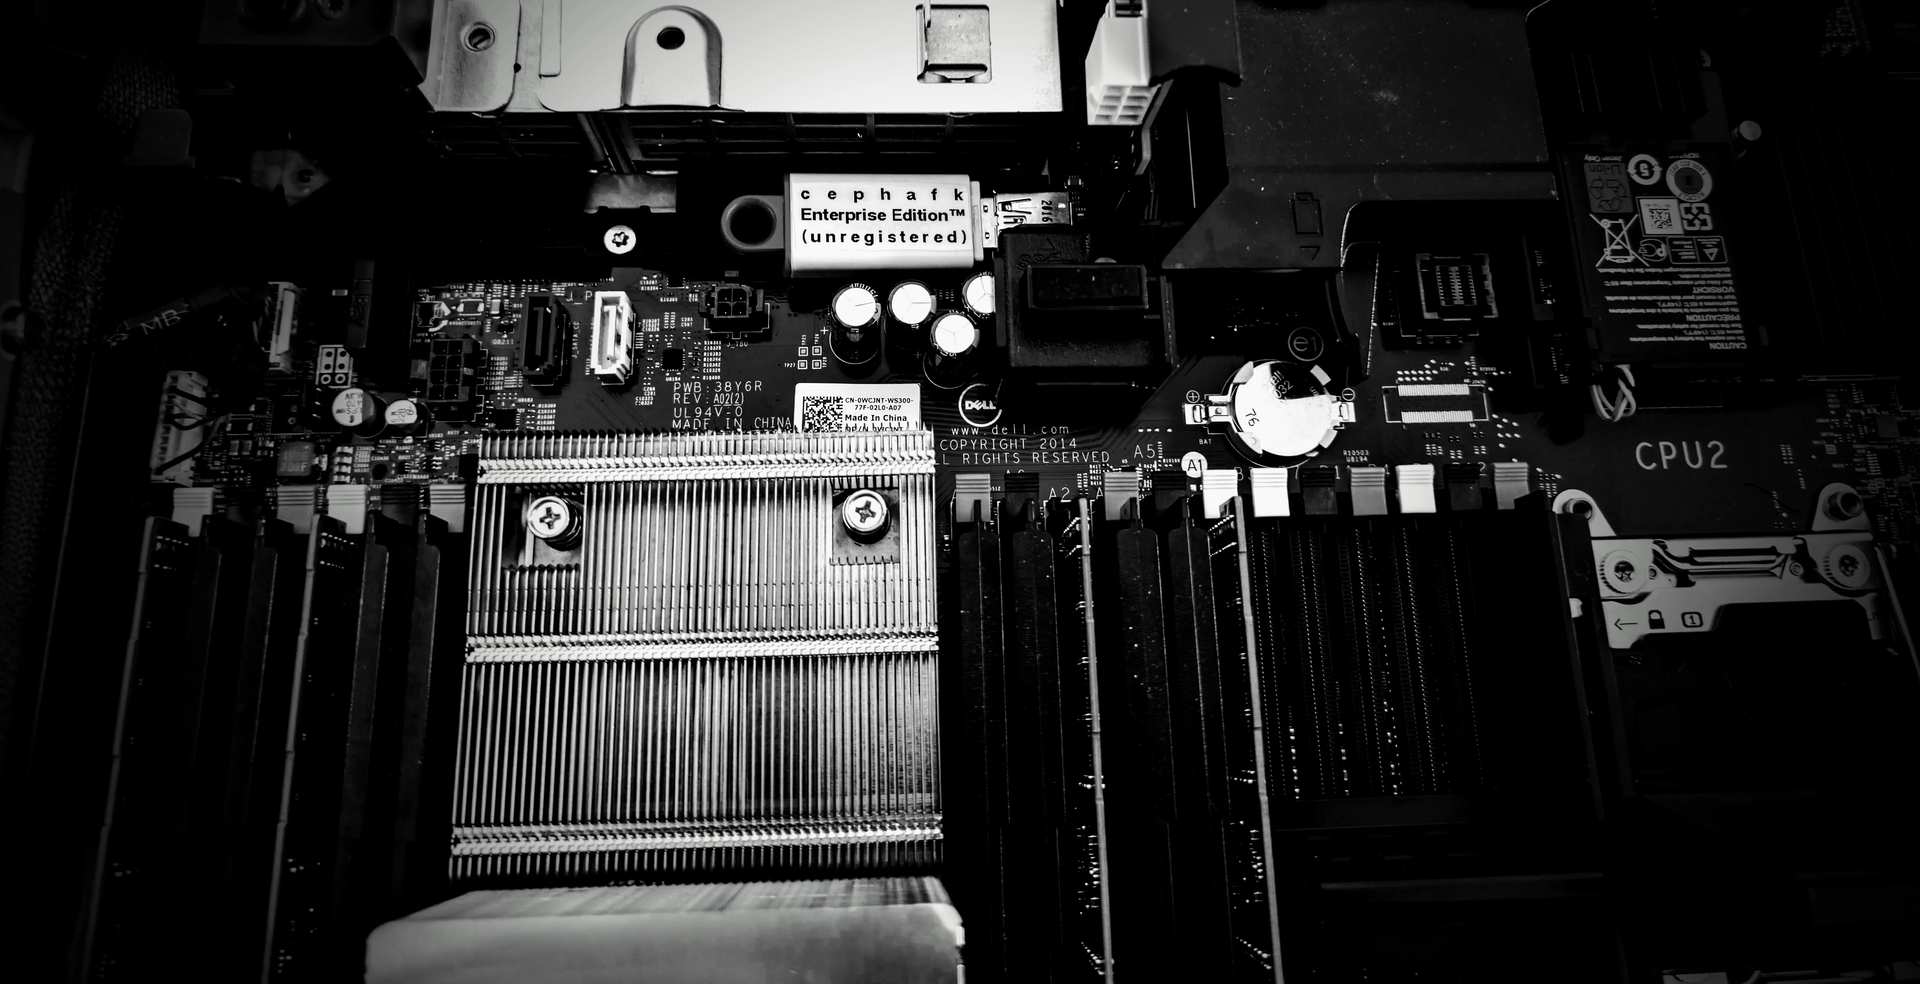
The box is the same one from the Xeon post. A Xeon E5-2620 v4, eight physical cores, sixteen threads, 128 GB of DDR3, no GPU, no swap. The engine is ik_llama.cpp on the feat/gemma-4-mtp branch. The verifier is gemma-4-26B-A4B-it at Q8_0, paired with its MTP drafter at Q8_0.
I’ll use 3 test prompts:
- a short chat turn
- a roughly five-thousand-token document to summarize
- a code generation request.
Greedy decoding, fixed seed, 256 new tokens, three repetitions, median reported.
Two things to clear out of the way before the numbers.
I ran the benchmark under llama-server rather than the llama-cli from the original command. The server is where the per-request speculative-decoding telemetry lives, which is the only clean way to check whether the drafter actually fired on a given request, and it is what the upstream pull request drives its own benchmarks through. Nothing about the config changes, just the harness around it.
And every number below is the full config with one flag changed, so each delta is that flag’s contribution given everything else is still on, not its effect in a vacuum. Flags interact. Speculation changes how much the thread count matters. Repacking changes what flash attention has to read. The deltas do not add up to the gap between this config and a naive one, and I will not pretend they do.
The whole board
Here is every lever that moves the needle, in one place, before I walk through them. Decode speed, tokens per second, median of the repetitions, each row the full config with exactly one thing changed. The percentage is against the published config, so a flag that helps shows up as a loss when you remove it.
| lever changed | chat | long doc | code |
|---|---|---|---|
| published config (autotune drafter) | 12.3 | 6.8 | 15.6 |
| drafter, fixed draft 1 | 15.6 (+27%) | 9.8 (+44%) | 15.9 (+2%) |
| drafter, fixed draft 2 | 16.1 (+31%) | 7.4 (+8%) | 17.8 (+14%) |
| drafter, fixed draft 3, autotune off | 13.9 (+13%) | 7.1 (+4%) | 18.3 (+17%) |
| drafter off entirely | 12.2 (wash) | 10.5 (+54%) | 12.2 (−22%) |
| flash attention off | 6.7 (−46%) | 4.3 (−37%) | 7.5 (−52%) |
threads -t 4 | 7.9 (−35%) | 5.0 (−28%) | 9.5 (−39%) |
threads -t 16 | 10.8 (−12%) | 7.1 (+3%) | 16.2 (+4%) |
| run-time-repack off | 11.8 (−4%) | 9.2 (+35%) | 13.7 (−12%) |
Everything else I tried, --mla-use, --cpu-moe, --merge-up-gate-experts, --no-kv-offload, the -sm graph cluster, lands within a few percent of the published config on chat and code, which is to say inside the noise. The long-document column is messier than the other two and I will come back to why in the repack section. Read the negatives as the interesting part. Most of these levers do nothing or cost you, and the work is concentrated in flash attention, the physical-core thread count, and the drafter once it is configured the right way.
The drafter is workload-dependent, and one setting was wrong
Speculative decoding is the most tuned part of the config, and it is where I found the most.
The first finding is that the drafter is not a free win across the board. Measured against turning it off entirely:
- On chat it is roughly a wash at the default setting.
- On code it is worth about twenty-eight percent. A real win.
- On the long document it makes things slower. Turning the drafter off is fifty-four percent faster. Summarization is hard to predict, the drafter’s acceptance rate sits down around 0.15. A draft that gets rejected most of the time is mostly overhead.
So the drafter wants to be gated by workload. On for code, off for long-context work. The config has it on globally, which quietly costs you about a third of your throughput every time you summarize something. This was not something I had clocked when I wrote the original post, and it is the single most useful thing in this one.
The same flag being a win, a wash, and a loss depending on the prompt is worth sitting with, because it is a tiny hand-measured example of a routing gap. The model already routes internally: a mixture-of-experts gate sends every token to the experts it judges most useful, learned and conditional, per token. But that gate optimizes for the next token, not for which inference machinery pays off on a given kind of work. The choice I am making by hand here, speculate on code, do not speculate on the summary, is a second and coarser routing decision sitting one level up, per request instead of per token, and the config hardcodes one answer to it and applies that everywhere. You could imagine a cheap classifier in front of the engine that picks the decoding policy the way the expert gate picks experts, and --spec-autotune is a clumsy first stab at that idea, aimed at a single knob and, on this workload, aimed badly. I am not saying the expert routing is broken. I am saying there is a routing decision above it that my numbers say is worth making, and I made this one with a shell script and a stopwatch… metaphorically. The stopwatch is a metaphor to be clear.
The second finding is a setting I had wrong. In the Xeon post I described --spec-autotune as the way to squeeze the most speed out of speculation. Over these generations it is the worst speculation setting I tested. Every fixed --draft-max beats it.
- chat: autotune 12.3 tokens per second, a fixed draft of 2 gets 16.1. Twenty-five flags, and the biggest single win in the file was deleting one of them and typing a number.
- code: autotune 15.6, a fixed draft of 3 with autotune off gets 18.3.
- long document: autotune 6.9, a fixed draft of 1 gets 9.8.
The mechanism is acceptance rate. A shorter, fixed draft gets accepted by the verifier more often. A draft of 1 on chat sits at 0.74 acceptance against autotune’s 0.37, and acceptance is the entire currency speculation trades in. The autotuner spends the generation hunting for a draft length, and over a couple of hundred tokens it never settles, so the average gets dragged below the steady state.
The honest caveat, because it matters: 256 tokens is a short generation. It is entirely possible that over a long session, a couple of thousand tokens, the autotuner converges up to the fixed rate and my numbers are simply under-reporting it. I have a test designed to settle that and I have not run it yet. So the careful claim is narrow: at short generation lengths, on this workload, a fixed draft beats autotune. Whether that survives at length is the next experiment. Either way it is a free win today, because picking a number puts the interactive prompts up around sixteen to eighteen tokens per second.
Flash attention is the one doing the heavy lifting
If you keep one flag from the whole spell, keep this one. Flash attention is worth roughly two times. Turn it off and chat falls from 12.3 tokens per second to 6.7, code from 15.6 to 7.5, the long document from 6.8 to 4.3. Forty-six, fifty-two, and thirty-seven percent gone, from a single flag.
It also turns out to be holding up the drafter, which I did not expect. With flash attention off, speculative acceptance collapses to near zero. So the flag doing the most obvious work is also quietly propping up the flag I just spent a whole section on. That is the kind of dependency you only see when you turn things off one at a time.
Threads want physical cores, and there is a wall behind them
This one I got right in the original, and now I have the number to back it. -t 8, one thread per physical core, is the sweet spot, holding chat at 12.3 tokens per second. -t 16, using all sixteen hyperthreads, slips to 10.8, slightly worse, because the work is waiting on memory and extra threads add scheduling overhead without adding bandwidth. The cores are stalled on DDR3, not on each other. -t 4 is about thirty-five percent slower on decode and closer to forty-five percent slower on prefill, which is the memory wall poking through.
While we are here, that wall is worth making concrete, because it tells you when to stop fiddling with flags. Gemma 4 26B-A4B activates about four billion parameters per token, which at Q8_0 is roughly 4.25 gigabytes read for every token generated. Divide that into the memory bandwidth this box can sustain and you get a ceiling around ten to eleven tokens per second for the verifier on its own. That is almost exactly where the thread sweep flattens out, which is how you know it is a real physical wall and not a tuning problem. Past that point, no flag saves you. The only move left is to read fewer bytes per token, which is the entire subject of the next post.
Repacking earns its keep on prefill
--run-time-repack mostly helps prefill, about nineteen percent on the chat and code prompts, with a small and noisy effect on decode for those two. It spends a few seconds at startup physically rearranging the weight matrices to match how the CPU wants to read them. On a Q8_0 model that is a modest, real win, and worth the startup cost.
There is one honest oddity the board above will have flagged. On the long document, turning repack off reads about thirty-five percent faster on decode, which is the opposite of what a prefill optimization should do. It is not a prefill effect. It is the drafter’s long-document acceptance jumping, from around 0.15 to around 0.41, when the weights are not repacked. I do not yet know why repacking the tensors should move acceptance at all, so I am flagging it as a loose thread rather than dressing it up as a result. It is also most of why the long-document column on the board is noisier than the other two.
It also has a much more interesting and much worse behavior on a different quant, which is a cliffhanger for the next post.
The flags that do not take for free
This is the half I warned you about. None of it is dramatic, and most of it is not “useless flag,” it is “flag that needs something you might not have”. I ran each one as its own measurement specifically to pin down which is which, with the engine log as evidence rather than a hunch.
--mlock needs a persistent memory-lock limit, and it worked last time. I have to be careful with this one, because it is easy to tell the wrong story about it. mlock pins the weights in RAM so the kernel cannot page twenty-five gigabytes of model out to disk and drop your speed to zero. In the Xeon post it worked, because I had raised the memlock ulimit on that box. For this round of measurements the box had been rebooted, the ulimit had quietly reverted to its tiny default, and mlock fell back to running unpinned behind a one-line warning. That is not the flag doing nothing. That is my host setup not surviving a reboot. The fix is to raise the limit persistently, in the systemd unit or limits.conf, not in a shell that dies when you log out. On a box with no swap, like this one, pinning is belt-and-suspenders anyway, but on anything with a swap device it is the difference between steady output and a sudden cliff.
-sm graph and its friends want more than one device. The -sm graph -smgs -sas -mea --split-mode-f32 cluster is about splitting the work across multiple processors or sockets. This box is one CPU with no GPU, so there is nothing to split across, the engine says exactly that, and it falls back to a sequential layer split. I keep these in as a forward bet, because the moment you put this on a two-socket board they start mattering, and -sas is there for precisely that. On one socket they are inert, and that is expected, not broken.
--cpu-moe and --merge-up-gate-experts fire but do not move the needle here. These two do engage. The log confirms the fused expert path is active. But switching them off lands inside the run-to-run noise on this hardware and workload. So the honest verdict is narrower than the rest: they take, they just do not measurably change decode speed on this box. They may well earn their place on a different CPU. Engaged and useful are not the same property, and the only way to tell them apart is to measure.
--mla-use is the one that is genuinely not wired. Here is the second thing I had wrong in the original. I presented --mla-use 3 as active. It is not. MLA is a DeepSeek architecture feature, it is not implemented for Gemma 4, and the flag is accepted and silently ignored with no log line at all. I swept it from 0 to 3 to be sure. No difference. This is the one in the section you can actually just delete.
A general warning against reading any of this too hard. “No measurable difference on my box, on my workload, at these context lengths” is not “useless everywhere”. Several of these earn their keep on other hardware. The claim is deliberately narrow, and the only reason I can sort them at all is that I checked each one against the log instead of trusting the command.
The pitfalls
Not everything worth knowing is a tokens-per-second number. Three of these cost me real time, and they are the kind of thing you only hit by running the engine into the ground on purpose.
mlock fails silently. I covered the cause above, but the failure mode earns its own line, because it is nasty. mlock does not error out. It prints one warning and runs unpinned. A config that pinned your model perfectly last week can quietly stop pinning after a reboot, your speed gets unpredictable, and nothing in the output points at the cause. Set the limit in the unit file, and check the startup log actually says it took. Every boot.
-sm graph is a landmine that another flag is defusing. With the drafter on, the engine sees that graph split is unsupported under MTP and quietly downgrades it to a layer split. That downgrade is the only reason the flag is survivable at all. Turn the drafter off, run the same config, and the model refuses to load:
error loading model: It is not possible to use split mode 'graph'
with less than 2 devices
So a flag that does nothing useful on this box is also fatal on its own, and it only avoids exploding because a neighbor steps in front of it. You find that out by turning the neighbor off.
The slot-zero deadlock that ate an overnight run. The first full benchmark looked nondeterministic in a way that smelled like a memory death spiral. The chat prompt always finished, but the long document and the code prompt usually hit the timeout, including a 106-character code prompt that should take fifteen seconds. It was not memory. Under --parallel 8 the server has eight slots, but the drafter only works on slot zero on this build. Any request that lands on another slot deadlocks the instant it clears the cache, generates nothing, and never lets go:
kv cache rm [p0, end) ... id_slot=1 id_task=82 p0=0 <- then nothing, ever
The server assigns slots by prompt similarity, so which prompt drew the dead slot changed from run to run, which is where the fake randomness came from. Aggregated up, it looked like a resource problem. The per-request log showed a plain control-flow deadlock. Read the log, do not theorize about RAM. The fix is to pin every request to slot zero, which is also exactly what a single interactive user does anyway.
Setting a parameter to its own default breaks it. My favorite. The config passes no -c, so it runs at the model default context of 262144. Under llama-server that default path fails to initialize the drafter and wedges the server: it stays up, holds the port, and never reports healthy, so a naive wait-for-health loop hangs forever:
llama_init_from_model: n_batch and n_ubatch cannot both be zero
MTP context creation failed
Pass -c explicitly at any size, including 262144, the exact value the default would have resolved to, and it works. The bug is in the path that handles the missing flag, not in the number. I nearly shipped a wrong explanation for this, a theory about per-slot sizes built on two data points, and only dodged it because the benchmark actually ran the 262144 case instead of assuming it would fail. Run the experiment you think you can predict.
So which flags actually mattered
After all of it, the honest shape of the config.
The flags doing real, measurable work on this box are flash attention by a mile, the physical-core thread count, run-time repack for prefill, and the drafter for code with a fixed draft length. mlock belongs in that list too, as long as you set the limit so it survives a reboot. The rest is either waiting on hardware I do not have, firing without moving the needle, genuinely not wired, or a landmine held in check by a neighbor. Decode runs from about seven tokens per second on the long document up to sixteen on code, which is reading speed, and gating the drafter and fixing the draft length lift both ends from there.
I knew the rough shape of this before I started. I said half the flags would not take. What I did not have, and now do, is the sorted version: which half, the two settings I had wrong, the few that carry the whole thing, and the exact cost of each. Twelve of the twenty-five come out entirely, and the honest part is that deleting them changed nothing, because they were deadweight, and removing deadweight is free. The few tokens a second I picked up did not come from the cull. They came from fixing two flags I kept: trading the autotuner for a fixed draft length, which on its own takes chat from 12.3 to 16.1, and gating the drafter by workload. The config I keep is a good deal shorter than the one that went up on Hacker News, but the shortening and the speedup are two different stories, and only one of them is about deletion.
How to check your own
The transferable part of this is not my flag list, which is specific to this box and will go stale the next time the fork moves. It is the procedure, and there are four steps.
Check that the flag fired. For everything you are relying on, find the line in the engine log that proves it engaged: the init message, the = 1, the loaded-drafter block. There are three outcomes, not two. It engaged, it was declined with a warning, or it was silently ignored with no line at all. That last one, like --mla-use here, is the easiest thing in the world to cargo-cult, because it costs nothing, does nothing, and looks exactly like success.
Turn off one thing at a time. The whole approach only works if you change a single flag per run, off a config that already works. The marginal contribution given everything else is the number that is actually true. Change five flags at once and you learn nothing.
Gate by workload. The same drafter was a win for code and a loss for summarization. If your config hardcodes a choice that depends on what you are generating, you are leaving throughput on the floor for half of what you do.
Know your ceiling. Active parameters times bytes per weight divided by memory bandwidth gives you the verifier’s solo speed limit. On this box that is around ten to eleven at Q8_0. Once you are there, you are not adding flags anymore, you are reading bytes, and the only way down is fewer of them.
What is next
Every flag in this whole exercise either does nothing about the memory wall or chips at it sideways. The one lever that hits it head on is the one I never touched. Everything here ran at Q8_0.
Dropping the verifier to a smaller quant reads fewer bytes per token directly, which is the most honest way to buy speed on a memory-bound box, and it should be a clean win. It mostly is. But it also handed me the best benchmark trap I have ever walked into, where the single fastest config I measured was emitting pure garbage, and was fast precisely because it was garbage. That is the next post.
And yes. The next post is where we confirm my suspicion that this can run past 20 TPS.
Thanks for reading. If you want, you can stop reading here. I’ll add some meta commentary to the end, so those that don’t care can skip it. To those, see you all next time! o/
Meta Comments on this series
I didn’t plan to get lost in these weeds… but here we are.
Since last time, I’ve made sure to address the comments about link colors to make this WCAG compliant. Another big outstanding comment was that there was a clear lack of numbers.
I’ve tried to benchmark things here, but as it turns out, the combinatorial explosion of benchmarking everything is beyond my current compute and time constraints.
I’m glad about all the positive feedback I’m getting about this, and I keep ending up writing more. My plan was to “just” write a follow up with numbers, but then that turned into it’s own rabbit hole. And just before I shipped it, I thought “what if I looked into the difference between difference quantizations”… and of course, that gave enough content for an entirely separate post (that I think will likely be the one with the strongest numbers so far, I can’t wait to show it once I’ve done the final polish).
It’s important to remember that I am NOT an ML engineer. I’m here in the weeds with you, dear reader, and I may be saying things that aren’t correct. So I really encourage anyone with the interest to actually try and replicate some of this.
Point is. If something is wrong, I can probalby fix it. If you think I’m saying something stupid, tell me, that would be a great post. And by all means, apply this. Till next time.